
Back in May, we kicked off a 4-day work week pilot that’s running through the summer of 2022. We wanted to do this for lots of reasons, but our primary goals were to combat employee burnout, support better work-life harmony, and align with our values. And because of how we structure our work, we’re well positioned to give 4-day work weeks a try.
A key question going into the trial was whether we could achieve our goals without having a negative impact on our business outcomes. We had questions around whether a 4-day work week would affect our ability to complete projects on time, how we might manage client expectations, and whether it would impact our bottom line.
To ensure the trial was effective in helping us answer these questions, we put on our product management hats and framed this initiative as a problem to be solved.
This is part of a series focused on why Upstatement is trying a 4-day work week, what the experiment looks like, how it works, and why we believe it’s worth trying. We’ll post updates along the way and at the end of the experiment in August 2022, we’ll share how it went.
First, we defined our goals.
To craft our strategy for how best to measure the effectiveness (and impact) of a 4-day work week, we started with identifying the key questions that we wanted to understand. As a team, we brainstormed a (long) list—and while we came up with many, here are the three main questions that we prioritized:
- How might a 4-day work week affect employee burnout?
- How might a 4-day work week affect project health?
- How might a 4-day work week affect our financial goals?
Then, we created a measurement plan.
Establishing our primary research questions allowed us to develop a focused measurement plan and research tactics that would clarify these unknowns. And, we knew that to measure our experience effectively, we needed to gather multiple data points (from multiple sources) to ensure that we were capturing a holistic view of a given question and mitigating potential bias. We put together an approach that incorporated lots of inputs, both quantitative and qualitative, that could be used as leading and lagging indicators of the trial’s impact.
Here are a few ways that we’ve been gathering data throughout the trial period.
Qualitative, Leading
- Manager feedback
- Weekly employee sentiment surveys
- Weekly client check-ins
Quantitative, Leading
- Baseline employee sentiment survey
- Weekly project status scores
- Weekly employee sentiment surveys
- Time tracking reports
Qualitative, Lagging
- Manager feedback call
- All-staff reflection roundtables
Quantitative, Lagging
- Sales conversions
- Project profitability
- Client satisfaction surveys
A note on deciding what to measure.
While we had our guiding research questions, it’s another undertaking to decide what specific questions will inform an accurate, unbiased answer. How do we understand and measure the drivers of employee burnout? We looked to staff to learn when they experience burnout most acutely, and we reviewed existing studies and literature. Here are the drivers that we decided to measure week over week:
- Happiness
- Work stress
- Home stress
- Productivity
- Ability to complete work

Next, we socialized.
As Tito said in his initial post about our 4-day work weeks, we needed input from everyone to make this trial happen. Before the trial began, we shared the measurement plan at an all-company meeting and used that as a time to (1) share our approach to the trial and (2) ask for participation in things like weekly surveys and accurate time tracking. In an effort to garner honest feedback, we reinforced that constructive—or negative—feedback didn’t mean the trial was a bust, but presented opportunities for improvement.
Now, we monitor & adjust.
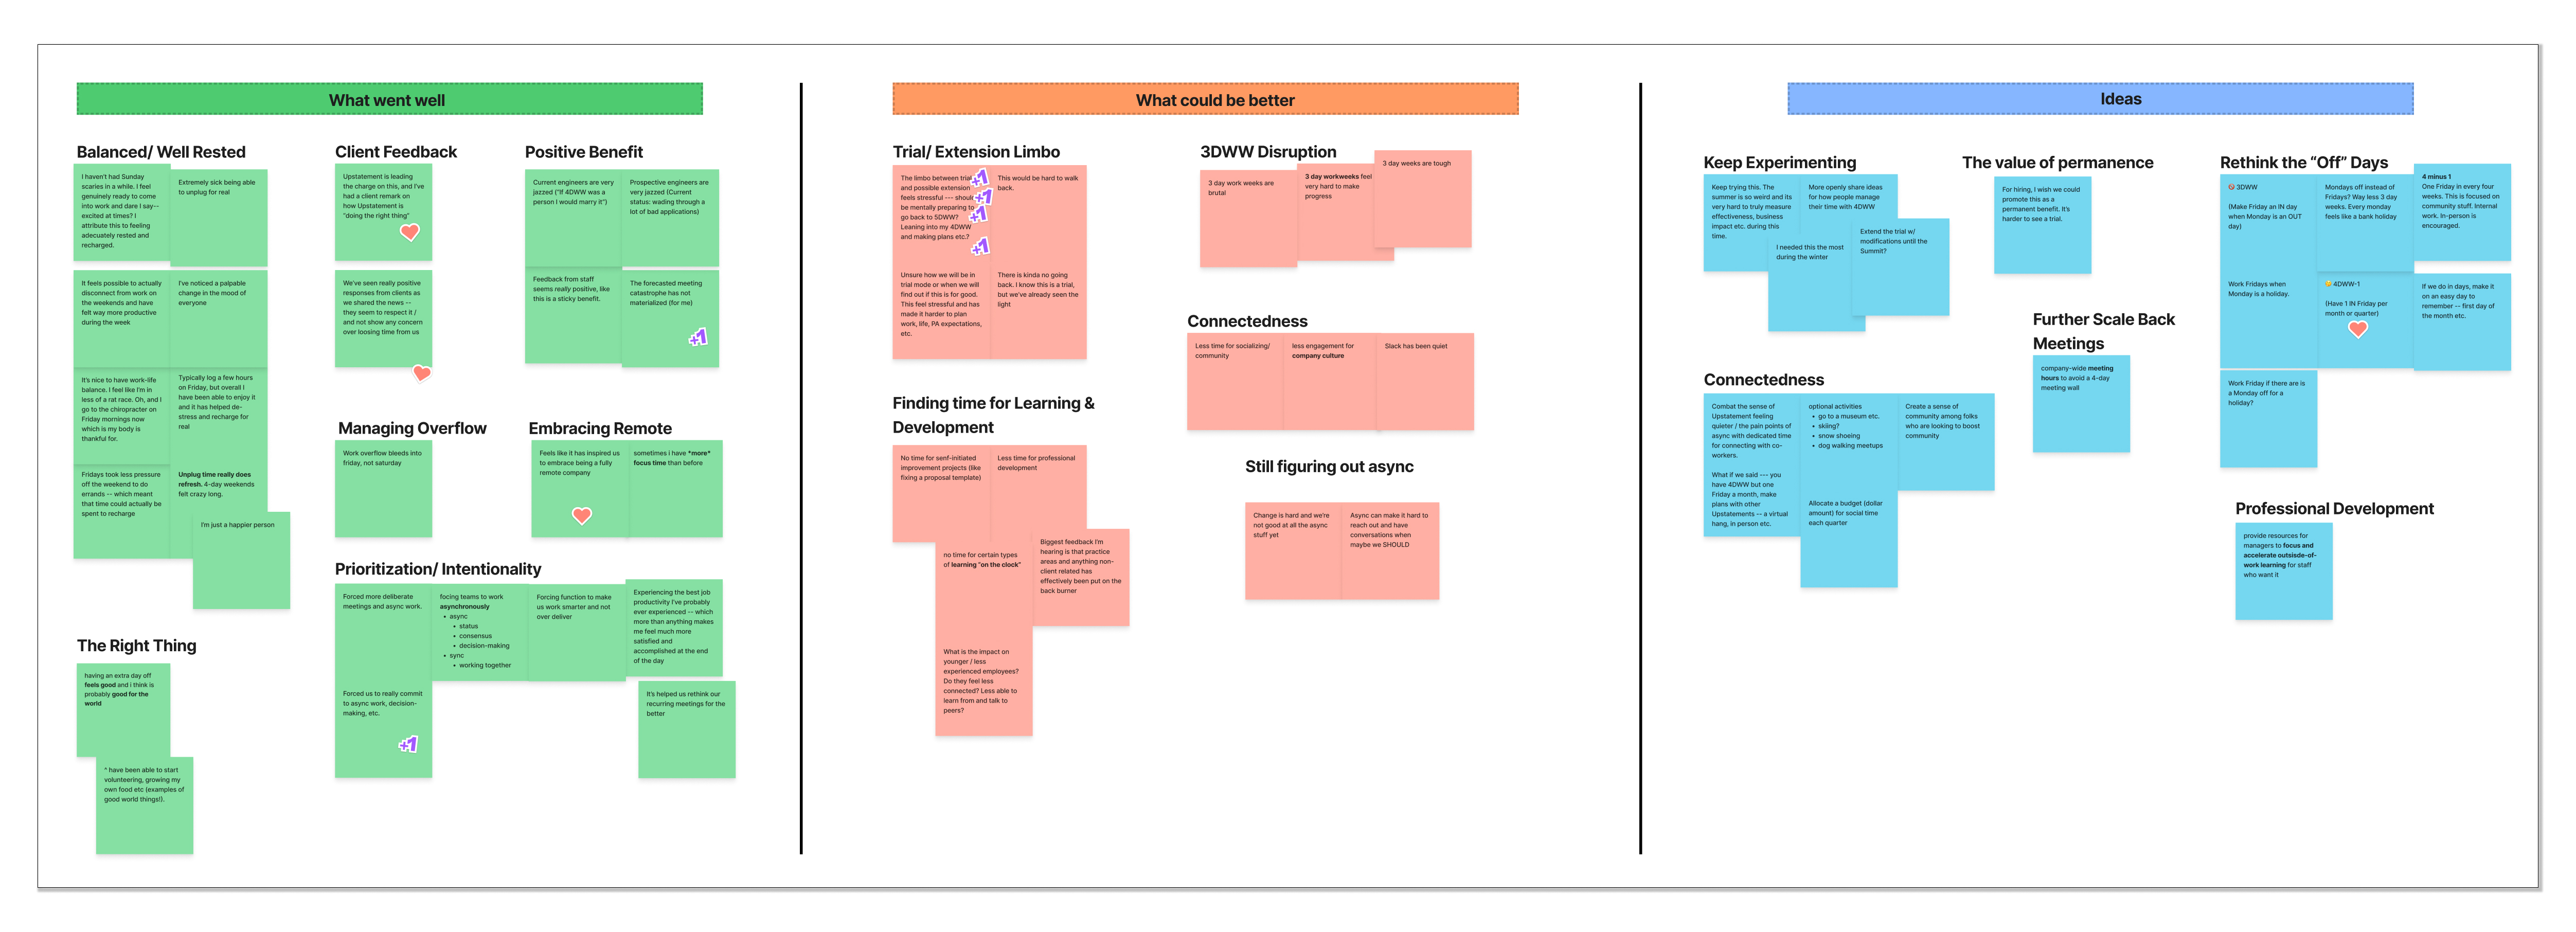
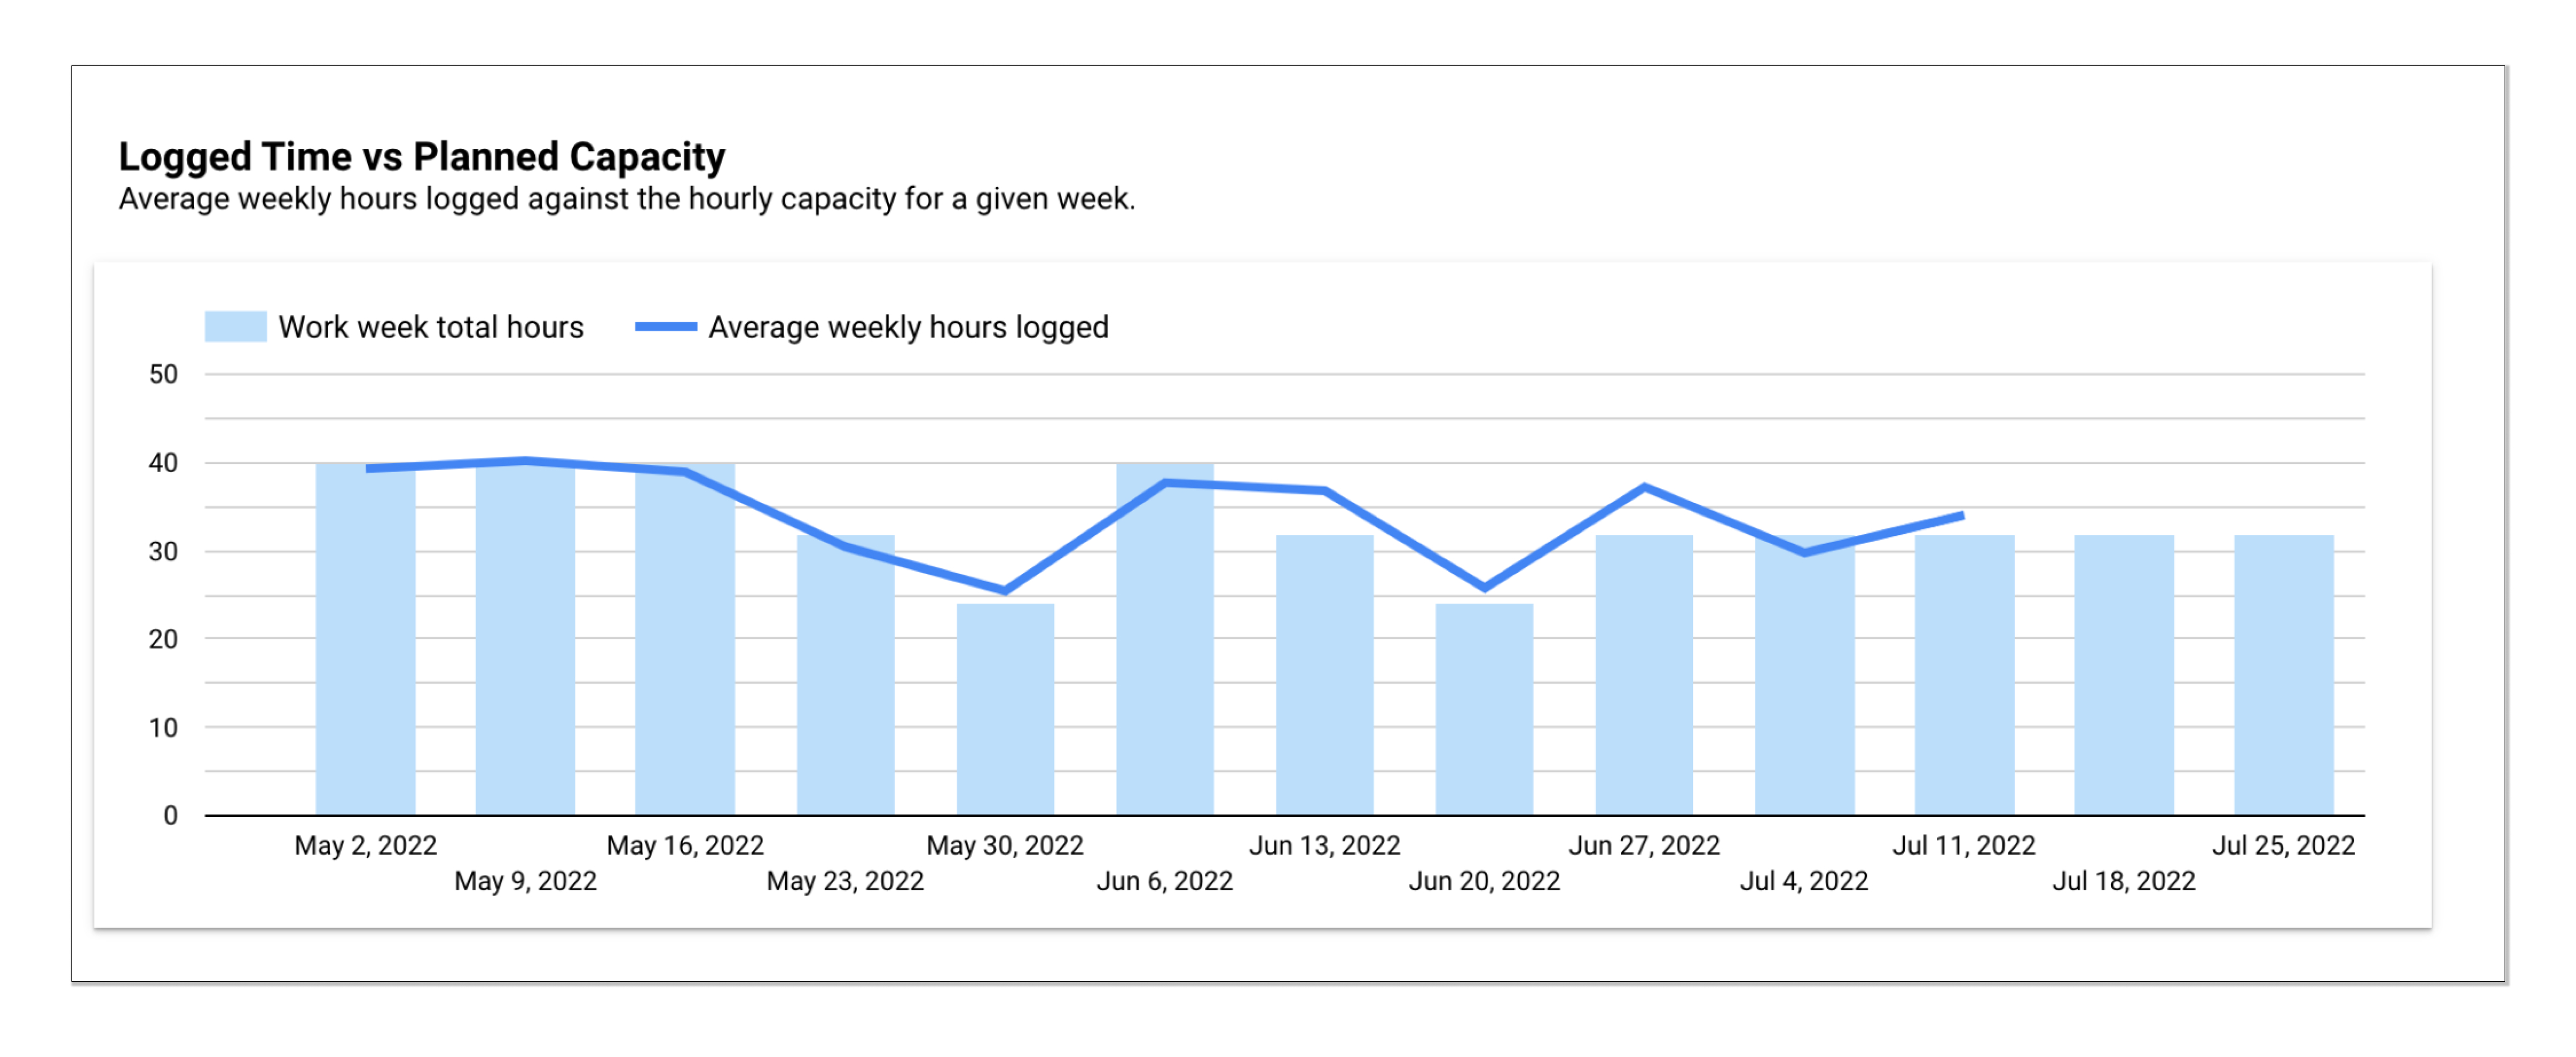
Over the past 7 weeks, we’ve been consistently gathering data and feedback from staff, clients, and systems. Because there’s a lot of information to take in, we designed a dashboard in Google Data Studio to help us visualize trends week over week. Doing so allows us to keep a pulse on what we believe are the most important leading indicators—employee happiness, stress, weekly project health scores, and staff capacity. The leadership team at Upstatement has dedicated time every Monday to review the data from the previous weeks and discuss what adjustments we should make.
What’s next?
As we near the end of the trial, we’re working on synthesizing our findings over the past weeks into a research report to review together. An element of that report that can’t be ignored is the environment in which we conducted this trial. A lot has happened since we began—economically, socially, and globally. That context is an essential lens through which we will review the results of our trial and decide how to move forward. We’ll keep you updated on what happens next.
Update: Our next installment is now live.