In 29 states, you can legally purchase a gun without a background check or a permit. If that figure surprises you, you’re not alone.
It’s not easy to keep track of the complex landscape of gun safety laws in America. But Everytown for Gun Safety, a nonprofit organization working to end gun violence, is changing that. For years, Everytown’s lawyers and policy experts have tracked the status of key gun laws in every state. They came to Upstatement looking to turn that comprehensive database into a tool that could reach — and galvanize — a mass audience. But how do you make a database of 50 gun laws across all 50 states compelling enough to propel change?
Craft a Unifying Message
Every client comes to us with a mental picture of what they want. It’s our job to interrogate the premise, get to the essence of their goals, and find the best way to execute. At the outset, Everytown wanted to:
- Build an exploratory hub where users could see how all 50 states compared across 50 key gun safety laws, with each state ranked based on how many of the laws it had in place.
- Create a resource that makes it easy for activists, policymakers, and volunteers to use this data in their day-to-day work.
- Raise awareness with a general audience and show how states can have a real impact on a seemingly intractable issue.
We knew reaching a general audience with this tool would be a challenge. So we set out to understand what might compel your average user to engage with this information. Through our research, we learned about some common misconceptions Everytown consistently runs into when it comes to gun laws. People generally tend to believe, incorrectly, that:
- State gun laws are stronger than they actually are
- Most states have similar gun laws
- Federal gun laws provide a strong, consistent baseline for all states
Because of these widespread misconceptions, many people are skeptical that new state gun laws can have an impact on gun violence. And while Everytown’s more engaged audiences — activists, policymakers, and volunteers — might have this context, they still craved detailed information that was easy to understand and pass on.
With this in mind, we knew we needed to make it clear why Everytown was tracking these laws in the first place. It wasn’t enough to just be a database of the status of 50 different laws; we needed to show users why those laws mattered.
We didn’t have to look far for the answer. It’s right in Everytown’s mission: to end gun violence and save lives. We realized we needed to center something that Everytown already knew: these gun laws lead to fewer deaths. And we could do that by including data on gun death rates across the country — data that Everytown was already tracking and publishing.
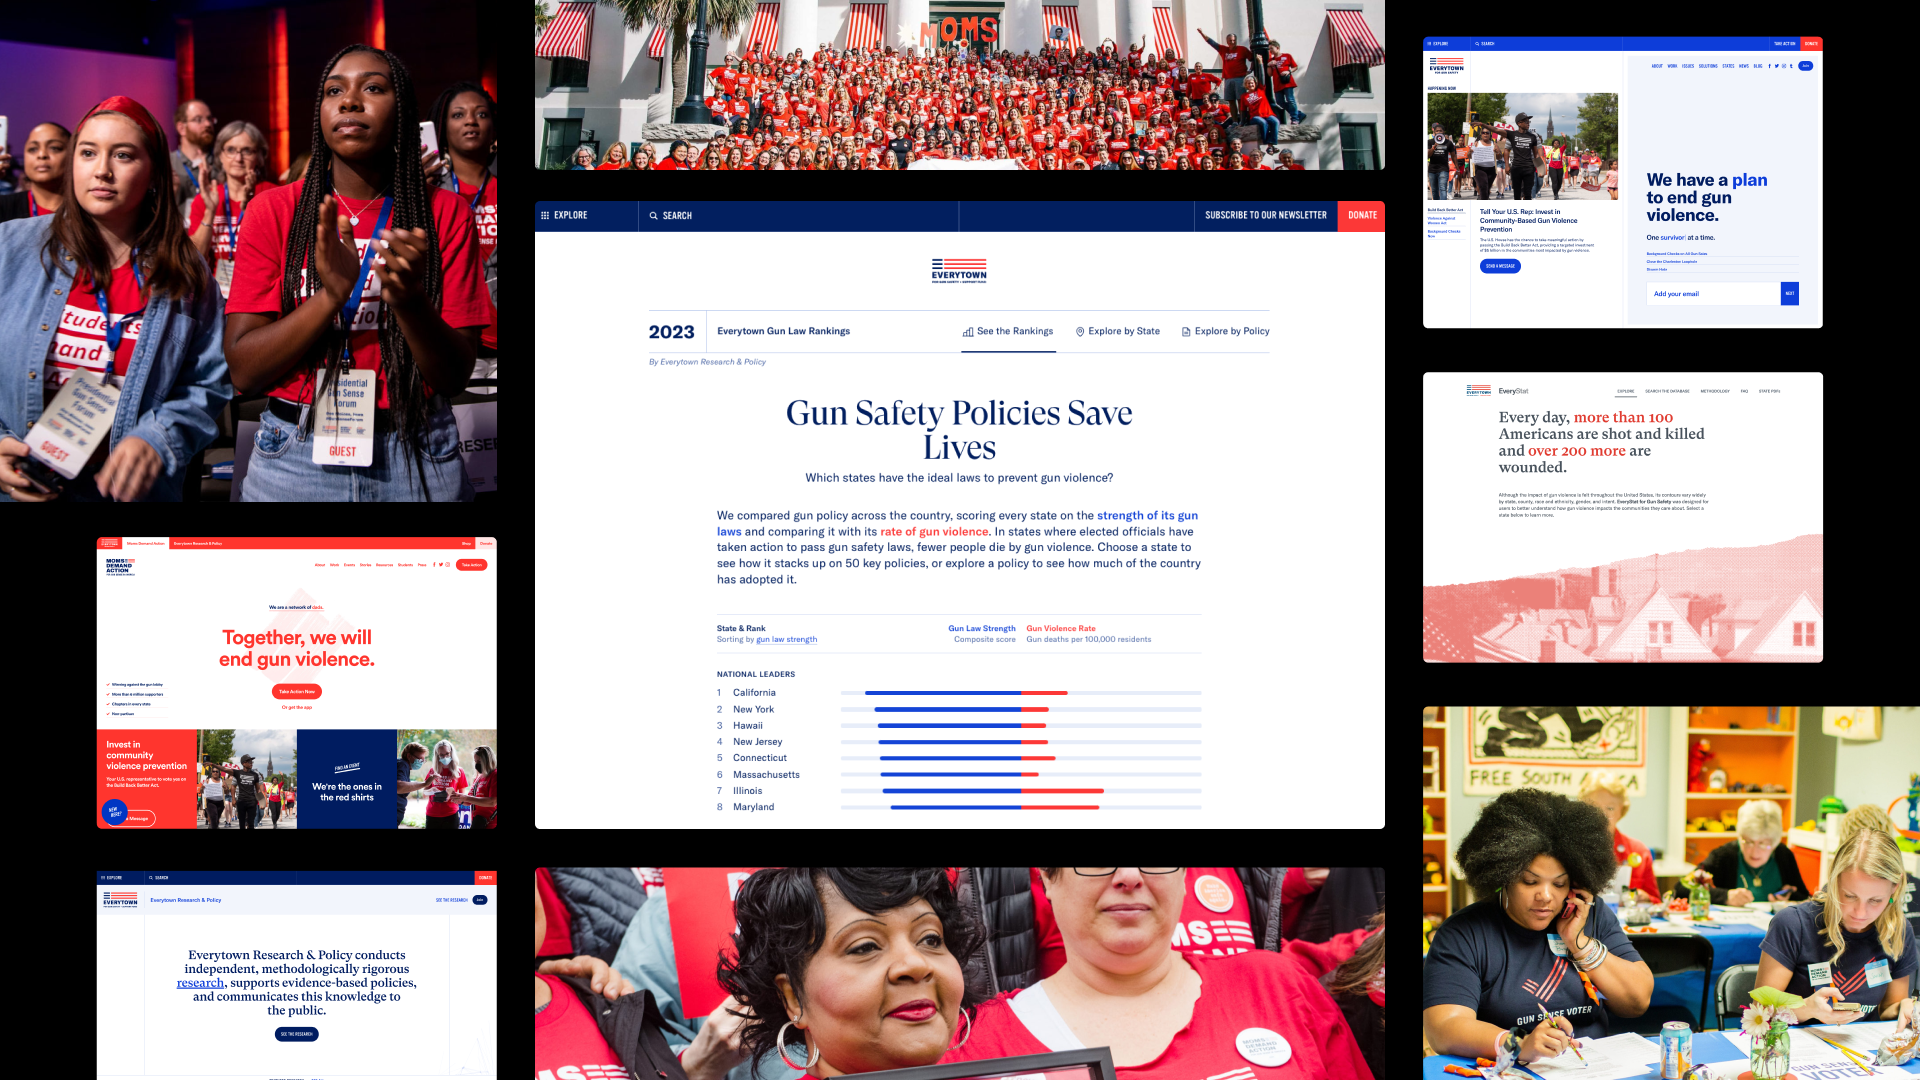
When we matched up Everytown’s gun law data with the death rates in every state, suddenly the story was crystal clear: States with strong gun laws have lower levels of gun deaths. We were able to quickly tell users what the data means and why it’s important. “Strong gun laws save lives” became our central message.
This visualization of gun law strength score and gun violence rate was a simple, impactful way to get that message across to users in an instant. It wasn’t exactly what we all envisioned at the outset. In fact, it was much simpler. But that’s what made it work. We met the audience where they were with a clear, direct message.
It’s a message that we extended to every part of the experience. That’s why as you browse through the rankings, from state pages to policy pages, you see the impact built into every part of the experience. So no matter how someone comes to it, it’s easy for users to see the power of strong gun laws.
Give Every Number Meaning
While bringing in the gun violence rate made it easier for us to illustrate the impact of these laws, it also meant incorporating yet another data point into the experience.
With so many numbers to show, we knew we needed to create frameworks to avoid overwhelming users and ensure the information was easy to understand. With that in mind, we rallied around the idea of “give every number meaning” and strived to ensure that every number we showed was paired up with additional context on what it meant.
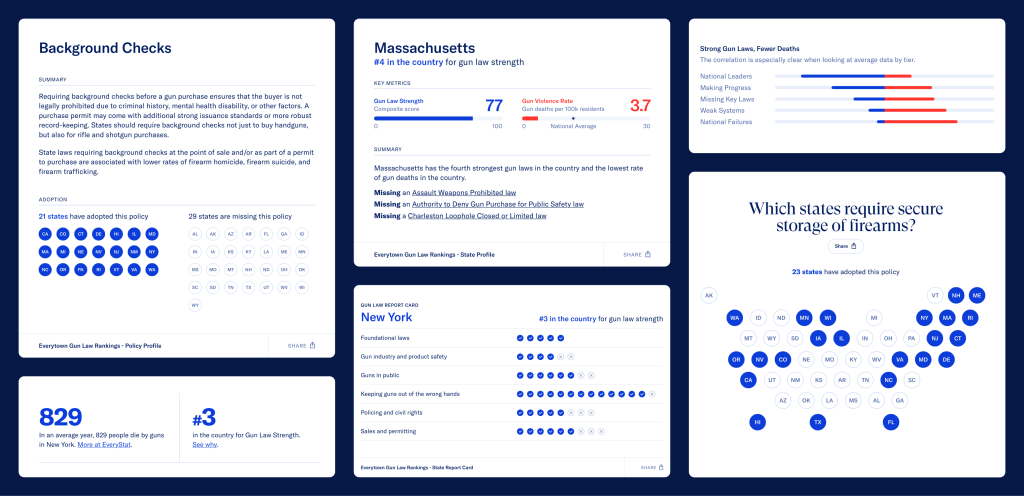
A gun law strength score of “34” might mean nothing by itself. But by showing that it was on a scale of 0-100, and contextualizing the score with language like “weak” or “strong,” we were able to ensure no matter how a user best processes information, they have what they need to make sense of it.
The same went for how we talked about the gun death rate. A rate of 26.3 gun deaths per 100k residents doesn’t mean much all on its own. But we made sure to create language around the rates, from “among the lowest” to “among the highest,” and to show the rate on a scale built around the national average.
And to make the list of 50 laws a little more approachable, we grouped them into six categories that spoke to the overall outcome each group of laws was working towards.
The Takeaway
Everytown came to us with an ambitious vision and the comprehensive data to back it up.
Together, we were able to unearth the most important message in the data, filter it through the lens of Everytown’s central mission, and elevate it. Taking a practical approach to data visualization made what we were trying to say more accessible to the users we wanted to reach.
And it worked! The Gun Law Rankings amplified Everytown’s mission and garnered national media attention, including live television spots on MSNBC and CNN, which led with the inverse of our key takeaway: States with weak gun laws have higher rates of firearm-related deaths.
Meanwhile, researchers continue to rely on the rankings as a resource, and Everytown just released a big update with the 2023 results. Which means that now is the perfect time to see where your state stacks up and learn how to take action.